APPENDIX 1: PARTICIPANT DEMOGRAPHICS
APPENDIX 1 – PARTICIPANT DEMOGRAPHICS
Visa held in lowest paid job in 2023-24
Four in five participants (80% , 6,627) held a student visa when working in their lowest paid job in 2023-24. Among non-student visa holders, the largest cohorts were Temporary Graduate (subclass 485) (4% , 334), Working Holiday (417/462) (3% , 270), skilled visas (1% , 104), and bridging visas (1% , 105). A further 2% were on a range of other visa classes and for 8%their visa in their lowest paid job in 2023-24 was unknown. There were 155 secondary visa holders.
Participants’ visa when working in lowest paid job in 2023-24 (n=8,269)
Breakdown of non-student visas (n=971)
Nationality of participants who worked on a temporary visa in 2023-24
Participants were nationals of 140 countries. The largest cohorts were from India (16%), China (11%) and Nepal (9%).
Nationalities of participants who worked on a temporary visa in 2023-24 (n=8,369)
Nationalities of participants who worked on a temporary visa in 2023-24 (n=8,369)
Year of arrival of participants who worked on a temporary visa in 2023-24
A majority of participants arrived in Australia within 18 months of the survey, including one in five (19%) who were in their first 6 months in Australia. Over three quarters had been in Australia for 2.5 years or less.
Year of arrival of participants who worked in 2023-24 (n=8,341)
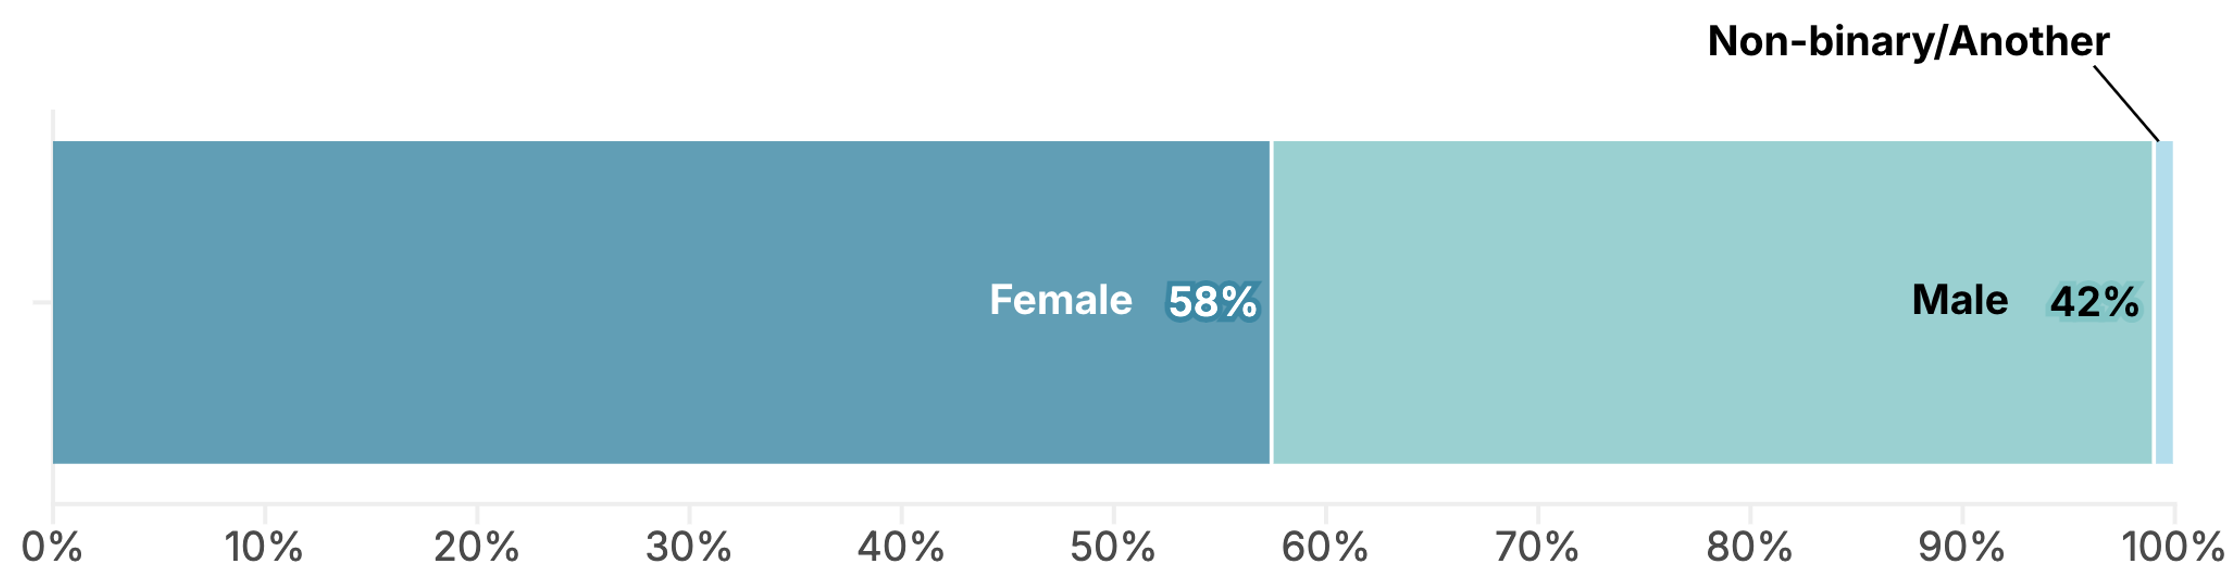
Gender
Substantially more women (58%) than men (42%) participated in the survey. One percent of participants identified as another gender.
Gender of participants who worked in 2023-24 (n=8,369)
Age of participants at the time of the survey
Participants were required to be at least 18 years old in order to participate in the survey. Forty one percent of participants were aged between 22 and 27. About a third were aged 30 years or older (31%).
Age of participants at the time of the survey, among those who worked in 2023-24 (n=7,616)
Location of participants’ lowest paid job in 2023-24
Participants’ lowest paid jobs were distributed across all states and territories. The majority (6,365 participants; 84%) were located in major cities. Around one in eight (975 participants; 13%) were located in Inner Regional Australia. The remaining 263 participants (3%) were located in Outer Regional, Remote or Very Remote Australia.