PART 3 - WAGES
Part 3 — WAGES
Australian Businesses Systematically Underpay Migrant Workers
This section reports on participants’ wages per hour in their lowest paid job between 1 January 2023 and 31 August 2024. We also compare these findings with those in our 2019 and 2016 surveys.
Defining underpayment
Minimum wages in Australia
All employees are entitled to a minimum wage for every hour they work, regardless of their immigration status.i For many employees, the minimum wage is set by the award that covers their industry or occupation. All employees not covered by an award or registered agreement are entitled to the National Minimum Wage.ii This is the minimum pay rate provided under the Fair Work Act 2009 and reviewed each year.
Awards generally set higher wages for overtime, and penalty rates for work at night and on weekends and public holidays.iii Awards may also establish age-based "youth rates" — minimum wages below the National Minimum Wage for workers under 21 years of age.iv
Under the Fair Work Act 2009, casual employees are entitled to a 25% loading on their hourly wage.v
i Fair Work Ombudsman, 'Visa holders and migrant workers – workplace rights and entitlements fact sheet' Fair Work Ombudsman (Webpage) https://www.fairwork.gov.au/tools-and-resources/fact-sheets/rights-and-obligations/visa-holders-and-migrant-workers-workplace-rights-and-entitlements.
ii Fair Work Act 2009 (Cth) s 294(3).
iii Ibid s 139(1).
iv Ibid.
v Fair Work Act 2009 (Cth) s 15A(1)(b) provides casual employees are entitled to a casual loading under the terms of a Fair Work instrument. Section 294(2)(c) provides this loading must at least equal the casual loading for award/agreement free employees. Over the past several years this loading has been 25% for award- and agreement-free employees: see e.g. Order of Justice Hatcher, President, Vice President Asbury, Deputy President Millhouse, Deputy President O'Neill, Ms Labine-Romain, Professor Baird, Mr Cully in Annual Wage Review 2025 (Fair Work Commission, PR786529, 19 June 2025) [5.1].
Two benchmarks for calculating underpayment in this study
Our analysis of rates of underpayment is based on two different calculation methods.[i]
How we measured underpayment
Each participant’s wage was tested against two independent benchmarks. Where information was missing, the most conservative assumption was applied at every step. Actual rates of underpayment are likely higher than reported here.

As in our previous surveys, we compared each participant’s hourly wage with the National Minimum Wage, and, where relevant, the casual minimum wage (the National Minimum Wage plus a 25% loading). From January to June 2023, the National Minimum Wage was $23.23 per hour. From 1 July 2023 to 30 June 2024 it was $24.10 per hour. In our analysis, payment beneath the National Minimum Wage was conservatively defined as payment of $22 or less per hour.
For the first time, in this survey we also asked participants a set of further questions that enabled us to more accurately calculate an approximate minimum wage for each participant in their lowest paid job in 2023-24. Where information was unavailable (such as specific job duties, or whether the participant worked before or after 1 July 2024), we assumed the most conservative measure. The calculation was based on the following:
Participants' lowest paid job minimum entitlements under the award for that job.[ii] This was calculated conservatively at the lowest classification level for that job under the award, as of 1 July 2023, even though many participants would have been entitled to minimum wages at higher levels. For participants aged 18-20, youth rates under the award were applied as relevant (only applicable to 10% of participants). Where no award covered a participant’s job, the National Minimum Wage on 1 July 2023 was applied.
Participants worked nights or weekends penalty rates specified under the relevant award were used as the relevant minimum, but only for participants who indicated that they worked those hours and never received higher wages, or did not know whether they received higher wages at those times (we assumed if they received meaningfully increased hourly wages they would have known). We conservatively used the lowest penalty rates under the award (i.e. not higher rates that may apply, for example, Sundays or public holidays). We further undercounted underpayment of penalty rates by not applying penalty rates to those who indicated they were sometimes paid more on nights and weekends. For that cohort, we do not know how much more they were paid after hours, so calculated their entitlements as if they had not worked nights and weekends.
Participants were not entitled to paid sick leave and annual leave: participant was not a permanent employee, so we applied a 25% casual loading to the participant’s minimum wage.
Participants on an ABN: we benchmarked a nominal individual minimum entitlement based on the minimum wage for a casual employee in that job, similarly taking into account the first two factors above.[iii]
Employers pay many migrant workers below the National Minimum Wage
Over a third (36%) of all participants were paid below the floor of the National Minimum Wage. Three quarters (75%) were paid below the statutory casual minimum wage (National Minimum Wage plus 25% loading).
In addition to general widespread payment below the statutory minimums, the distinct spike at $20 per hour (and to a lesser extent, $15 per hour) may suggest a sizable cohort of employers is paying migrant workers an arbitrary rounded rate that is unrelated to lawful minimum wages. It is also possible, however, that some survey participants rounded their hourly wage to these figures if they could not recall their precise rate.
Well over a third (36%) of migrant workers were paid below the National Minimum Wage floor
Participants’ hourly wage in their lowest paid job, including workers on an ABN (n=8,213)
"I once worked at a sushi restaurant, and there was a difference in the amount paid to employees. If you were good at English or good at serving customers, you were paid the legal hourly wage, but if you weren't, you were only paid $16–$18 per hour. I've seen friends who were paid less because they didn't speak English well and didn't think about getting another job, so they just took that amount and worked."
— Female international student from Korea, 24, in TasmaniaAustralian employers pay most migrant workers substantially below their individually calculated minimum entitlements
Among 5,469 participants who did not work on an ABN, two thirds (65%) were paid less than their individual minimum entitlements under the Fair Work Act, taking into account any relevant award, penalty and/or casual employment status.[iv]
Employers paid two-thirds of migrant employees less than they were owed by an average $8.80 per hour. One in five were underpaid more than $10 per hour and one in ten by more than $15 per hour.
Employers pay two-thirds of migrant employees less than their individual minimum entitlements under the Fair Work Act – many were paid far below what they were owed
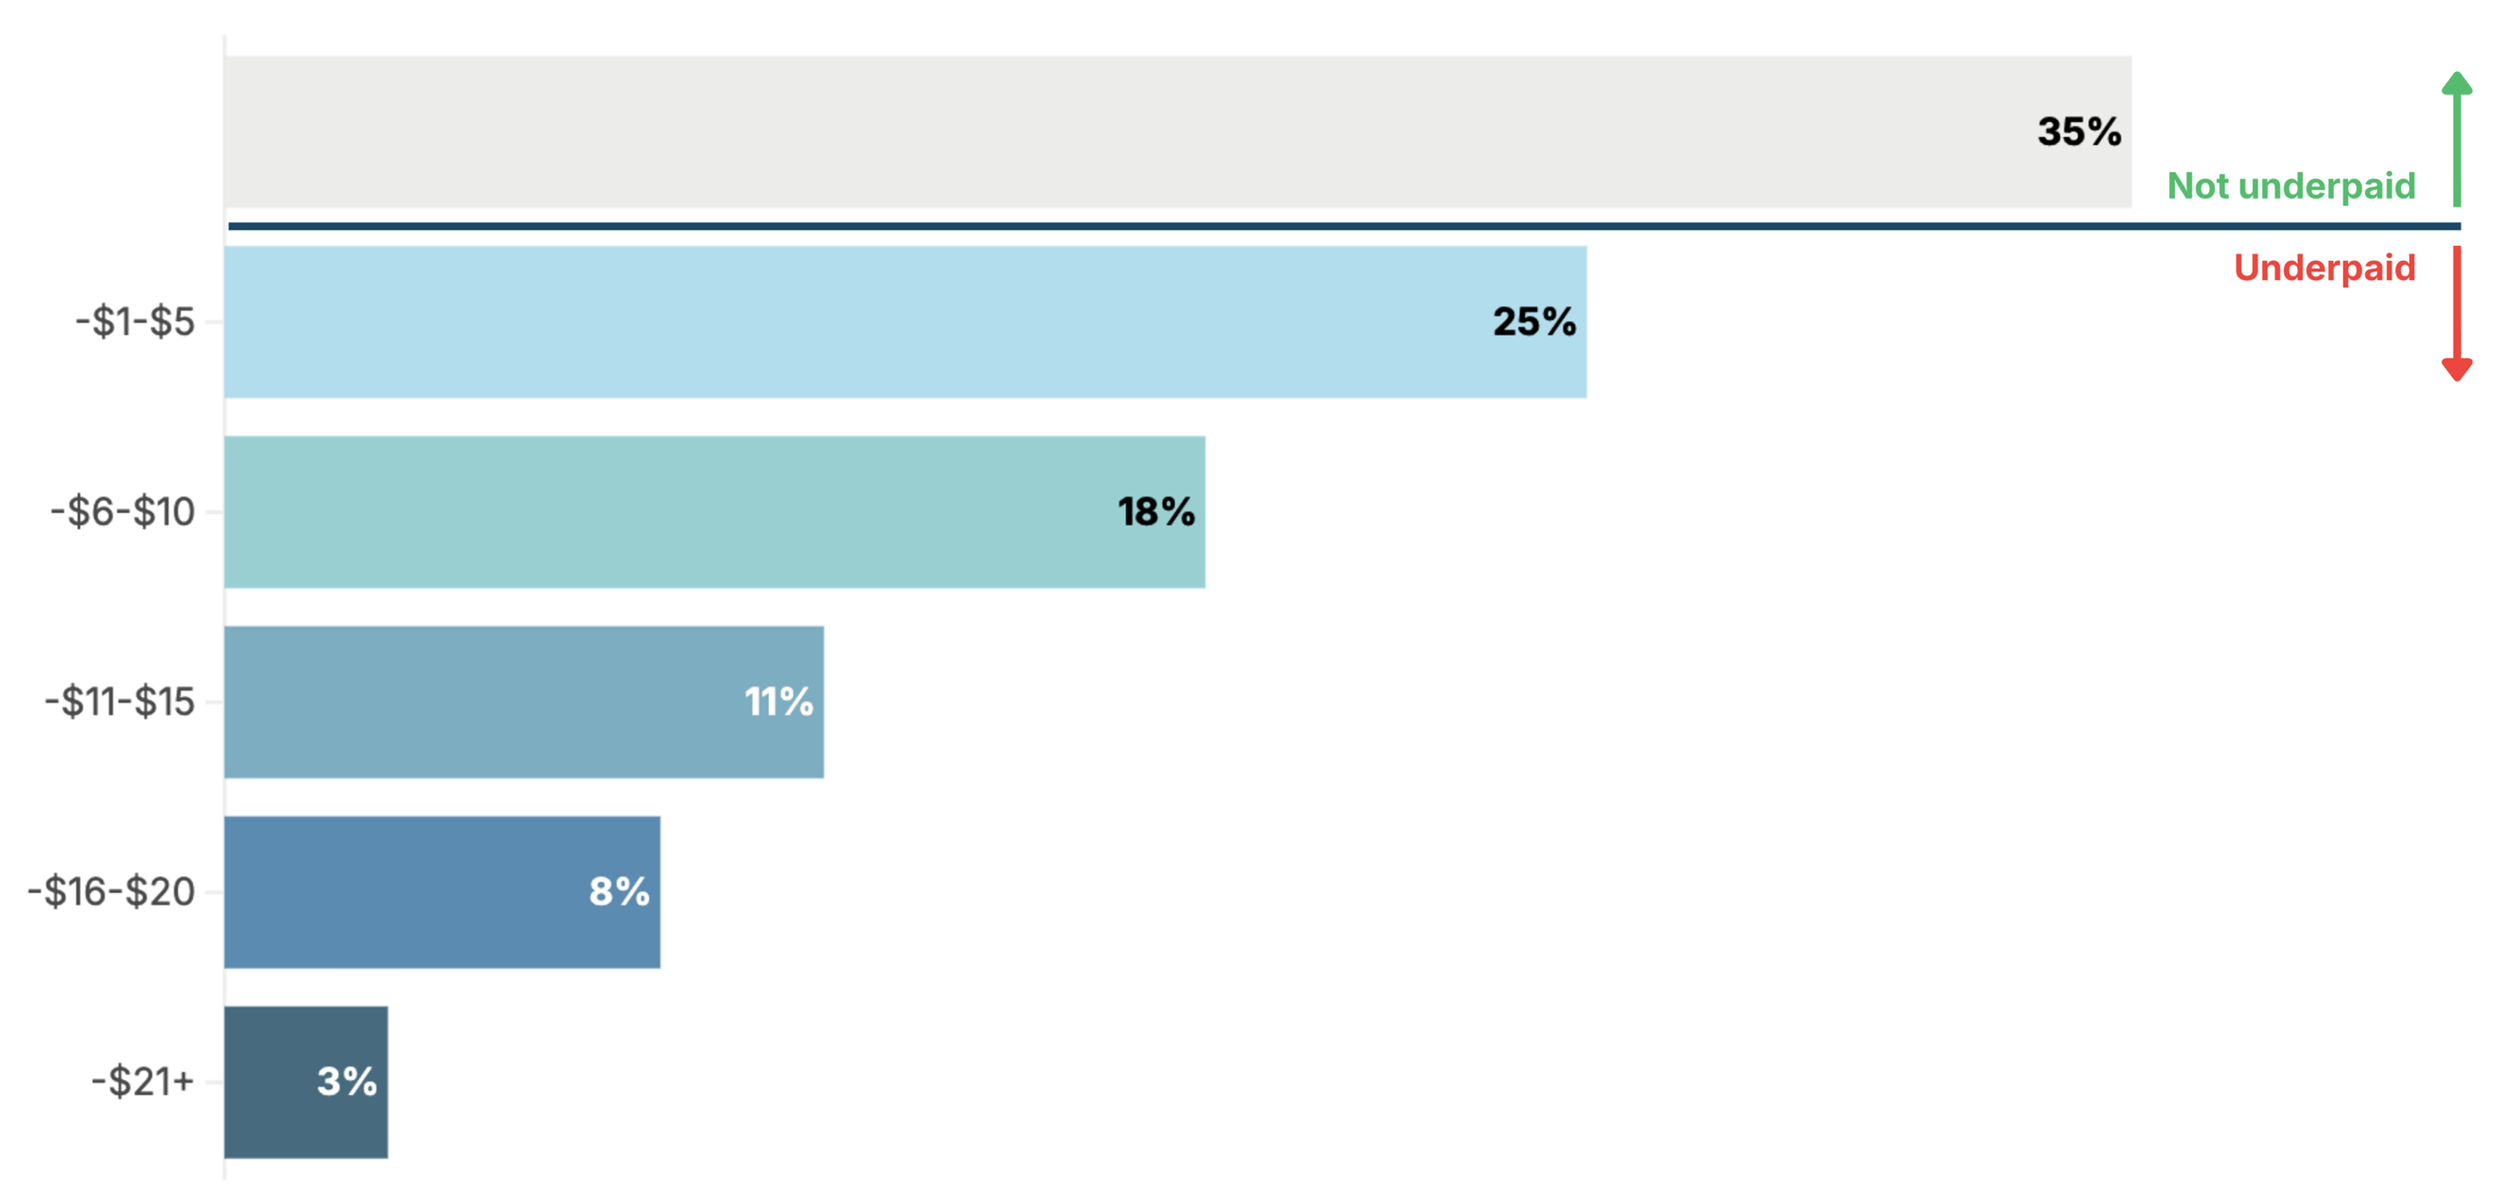
Dollars per hour participants were underpaid in their lowest paid job, comparing their hourly wage with their Fair Work Act individual entitlements (not including ABN workers) (n=5,469)
"Once, I asked my employer why I was hired as a casual worker and only paid $23, and he treated me like a complete idiot. He said that all restaurants and all Sydney stores are run like this, and if you want to find a place that pays more, look for it. He also said that all the employees who are working now are paid the same, and that he does not say anything."
— Female international student from South Korea, in NSWHow much are international students collectively underpaid in Australia?
Among 2,970 international student employees, the average underpayment was $8.90/hour. We focused our calculation on international students because of the particular robustness of our data on this large cohort, but many other visa holders are similarly underpaid. The overall amount underpaid to all migrant workers would be far higher.
The average underpaid international student would be underpaid by around $214 per week (based on 48 hours of work per fortnight, the limit permitted during term time on most student visas). For many, this would deprive them of the majority of their weekly rent (approximately $239 to $400 per week in a share house).i
The average underpaid international student is short-changed by $11,107 per year.
If this is representative of the full international student cohort working in Australia in August 2024, the survey data indicates international students in Australia are underpaid by around $61 million per week and approximately $3.18 billion per year.ii
i The majority of international students live in a share house: Berg and Farbenblum, Living Precariously: Understanding International Students' Housing Experiences In Australia (Report, December 2019) 7. The average cost of rent in a share house in a major city is between $239 and $400 per week: Australian Government, 'Cost of Living Calculator' Study Australia (Webtool, November 2023) https://costofliving.studyaustralia.gov.au/.
ii In August 2024 there were 679,293 international students in Australia: Department of Home Affairs, Student visa and Temporary Graduate visa program report (Report, 31 December 2024) 61. The Reserve Bank estimates that 61% of the international student cohort were working: Madeleine McCowage, Harry Stinson and Matthew Fink, 'International Students and the Australian Economy' Australian Economy Reserve Bank of Australia (Bulletin, 24 July 2025). From 1 July 2023 students have been permitted to work 48 hours per fortnight on their visa during term time, and unlimited hours during term breaks. The assumption of 24 hours per week is appropriate because although some working international students may work fewer hours than the 24 hour limit during term time, many international students likely work more than 24 hours per week outside term time (approximately a third of the year), and some work more than their permitted 48 hours during term time.
Our underpayment estimates are based on the proportion of international student employee survey participants who reported experiencing underpayment (69%). An alternative approach would be to calculate the average underpayment across all student employees, including those who were not underpaid, which would reduce the estimated average to $6.10 per hour. Applying this average to the overall proportion of working students in Australia would produce an estimated total underpayment of approximately $60.7 million per week, or $3.15 billion per year.
Comparing wages to survey findings in 2016 and 2019
In 2016, we surveyed 4,322 temporary migrants across Australia about their experiences at work in Australia - mostly international students and Working Holiday Makers.[v] In 2019, we surveyed 2,472 international students about their working conditions in Australia.[vi]To evaluate change over time, we compare our current findings on international students with our findings from the 2016 and 2019 surveys, and we compare our findings on Working Holiday Makers with our findings in the 2016 survey.
In 2016 and 2019 we did not calculate individual minimum entitlements taking into account relevant award wages, casual status and penalty rates. Instead, across all three surveys we measured underpayment relative to the National Minimum Wage at the time. We therefore use that as the relevant comparator.
It is clear from the 2024 survey that underpayment below individual entitlements remains widespread. However, compared to our previous surveys, the proportion of participants earning below the base National Minimum Wage floor has fallen, as has the proportion earning far below the National Minimum.
In 2016 and 2019 around a quarter of international students (26% and 24% respectively) earned less than two thirds the National Minimum Wage. In 2024 only 5% earned these severely low wage rates.
The bottom end of underpayment has improved for international students: substantially fewer are earning below the National Minimum Wage in 2024 than in 2019 or 2016
Proportion of international students in each wage rate bracket as a proportion of the National Minimum Wage at time of survey, comparing current survey with survey data from 2016 and 2019
In 2016, 59% of Working Holiday Maker survey participants earned below the National Minimum Wage compared with 27% in 2024. In 2016, 32% of participants earned less than two thirds of the National Minimum, compared with 9% of participants who earned these severely low wages in 2024.
The bottom end of underpayment has improved for Working Holiday Makers: substantially fewer are earning below the National Minimum Wage in 2024 than in 2016
Proportion of Working Holiday Makers in each wage rate bracket as a proportion of the National Minimum Wage at time of survey, comparing current survey with survey data from 2016
There are several potential explanations for the decrease in the proportion of participants paid at the most severe levels of underpayment. A key driver is likely the substantial reduction of international students and Working Holiday Makers in Australia during COVID coupled with acute labour shortages that may have removed the very low paid jobs at the bottom of the market. There has also been progressive tightening in the labour market since the 2016 and 2019 surveys were conducted, with national unemployment moving from 5.8% in 2016 to 5.0% in 2019 and 4.0% in 2024,[vii] which may have allowed some migrants to move to better paid jobs.
Policy reforms and Fair Work Ombudsman information and enforcement campaigns may have contributed, in the context of a growing recognition by government and business of the extent of wage theft following numerous high-profile wage theft cases involving migrants. For instance, one key driver for the improvement among Working Holiday Makers may have been the introduction in 2022 of the Horticulture Award requirement that ‘piece rates’ be set at a level which allows a competent pieceworker working at an average productivity to receive more than a specified minimum rate. In this survey, 18% of Working Holiday Makers had their lowest paid job in horticulture.
Another potential contributor could have been improvement in migrant workers’ awareness of minimum wages, although the data suggests this is not the case. Comparing our data on international students across the 2016, 2019 and 2024 surveys, there has always been a reasonably high proportion of participants who knew the National Minimum Wage. Among participants paid below the National Minimum Wage in 2016, 73% knew the National Minimum Wage, compared with 83% in 2019 and 72% in 2024. Knowledge of the minimum wage for a casual employee has remained consistently low, with only a small increase from 25% who knew the casual minimum in 2019 to 34% in 2024 (we did not ask this in 2016). About a quarter of participants still do not know the National Minimum Wage and two thirds of participants still do not know the casual minimum wage.
Finally, three differences in survey methodology may provide a partial explanation. First, previous surveys asked about migrants’ lowest paid job at any point, whereas the 2024 survey focused on migrants’ lowest paid jobs in 2023-24. It is possible that earlier survey data captured more historic wage rates, though the impact of this would have been moderate as 76% of participants had arrived within two years of the 2016 survey[viii] so the time periods would have been comparable for most participants. Second, in the 2024 survey we have a substantially larger international student survey population than previous surveys, with many more students recruited through emails sent by their education provider rather than primary reliance on recruitment via social media and other methods in prior surveys. We also offered more gift card prizes in the 2024 survey than in previous surveys, which likely broadened participation by international students and provided additional motivation beyond reporting negative experiences. In combination these factors may have increased participation among students.
References
[i] Award rates were calculated as at 1 July 2023.
[ii] Ibid.
[iii] As discussed in the next Part, most of these were likely misclassified employees, and potentially victims of sham contracting, legally entitled to the National Minimum Wage and casual loading. Others worked in jobs in which it was more likely they were lawful Independent Contractors, with no minimum wage entitlements in their lowest paid job between 2023 and August 2024. We look at the wages of both groups in relation to the National Minimum Wage. Some lawful Independent Contractors such as delivery riders are at such a structural disadvantage they should morally expect to earn income at least above minimum wage, and generally above the casual minimum wage, given that like casual employees they do not get paid leave, regular hours or other Fair Work Act entitlements: Fair Work Act 2009 (Cth). The structural disadvantage of these workers has now been recognised with the introduction of the "regulated worker" category in the Fair Work Act that opens the possibility for minimum standards for these workers.
[iv] Award rates were calculated as at 1 July 2023.
[v] Laurie Berg and Bassina Farbenblum, Wage Theft in Australia: Findings of the National Temporary Migrant Work Survey (Report, November 2017).
[vi] Bassina Farbenblum and Laurie Berg, International Students and Wage Theft in Australia (Report, June 2020).
[vii] ABS, Labour Force, Headline estimates of employment, unemployment, underemployment, participation and hours worked from the monthly Labour Force Survey (Release, 19 February 2026) https://www.abs.gov.au/statistics/labour/employment-and-unemployment/labour-force-australia/latest-release; ABS, Labour Force, Australia Summary results of the monthly Labour Force Survey containing estimates of employed and unemployed persons (Release, 23 January 2020) https://www.abs.gov.au/statistics/labour/employment-and-unemployment/labour-force-australia/dec-2019.
[viii] Laurie Berg and Bassina Farbenblum, Wage Theft in Australia: Findings of the National Temporary Migrant Work Survey (Report, November 2017) 15. Likewise for the 2019 survey see: Bassina Farbenblum and Laurie Berg, International Students and Wage Theft in Australia (Report, June 2020) 21.